
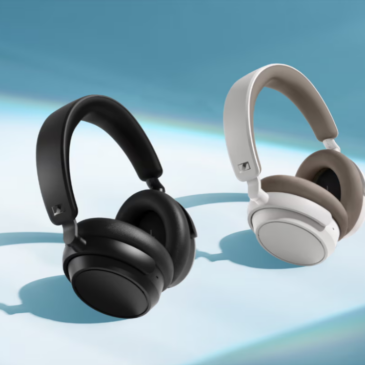
PR: Sennheiser Accentum Plus Now Shipping
“ACCENTUM Plus expands the reach of MOMENTUM 4’s most coveted conveniences, while upholding the spirit of the ACCENTUM family’s incredible value,” says Christian Ern, Sennheiser Principal Product Manager, “The Plus sits right in the sweet spot of blissful sound and … Continued
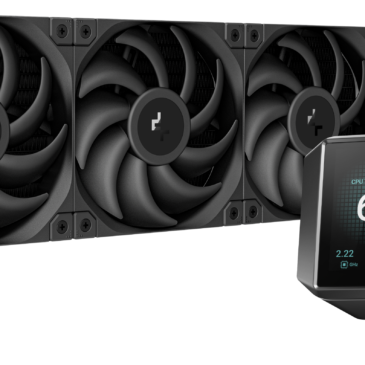
PR: DeepCool Brings the Mystique to Cooling
[California, U.S.], [February 20, 2024] – DeepCool, a leading manufacturer in PC cooling solutions, is thrilled to introduce the MYSTIQUE AIO series line of liquid coolers designed to elevate the gaming and high-performance computing experience. The MYSTIQUE AIO coolers boast … Continued

PR: TCL Shows off 115-in MiniLED Quantum Dot TV
TCL isn’t usually known for super high quality TVs, but at CES they just announced their massive 115-inch TV. This uses MiniLEDs and Quantum Dots to make it pretty special. The best thing is that this should be available on … Continued
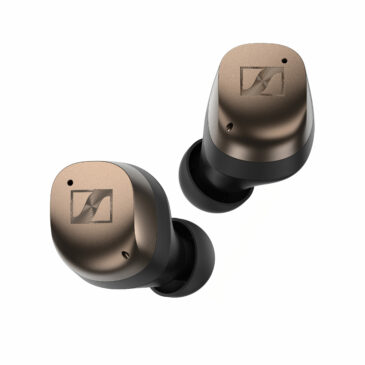
Sennheiser Triples Down at CES 2024
Las Vegas, Nevada, January 8th, 2024 – The all-new MOMENTUM True Wireless 4, ACCENTUM Plus, and MOMENTUM Sport make their debut at the Consumer Electronics Show, ushering in a new generation of feature-packed devices. The Sennheiser brand showcases premium earbuds … Continued
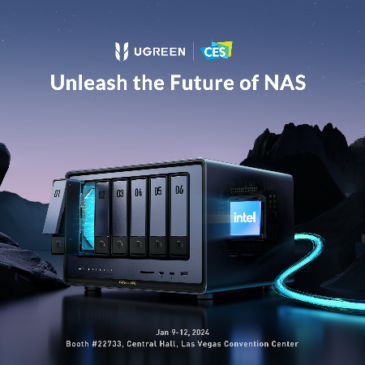
PR: Ugreen Unveils new NASync at CES 2024
LAS VEGAS, Jan. 8, 2024 /PRNewswire/ — Ugreen, a leading brand in consumer electronics.They’ll be unveiling their rendition of NAS devices along with vehicle accessories to complement their portable power station, aptly titled the PowerRoam series, at CES 2024 (booth No.22733), running from January … Continued
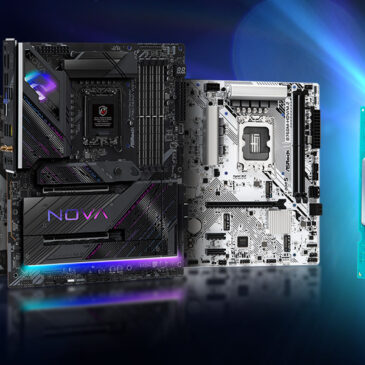
PR: ASRock 700/600 Series Motherboards Support Intel ® 14 th Gen Non-K Series Processors
TAIPEI, Taiwan, January 9, 2024 – ASRock proudly announce its Intel 700/600 series motherboards are now compatible with Intel's latest 14 th Gen non-K processors. Users simply need to update BIOS to the latest version to take advantage of the … Continued